
Processes & trends
Follow a metric over time and find the applications contributing to the workload.
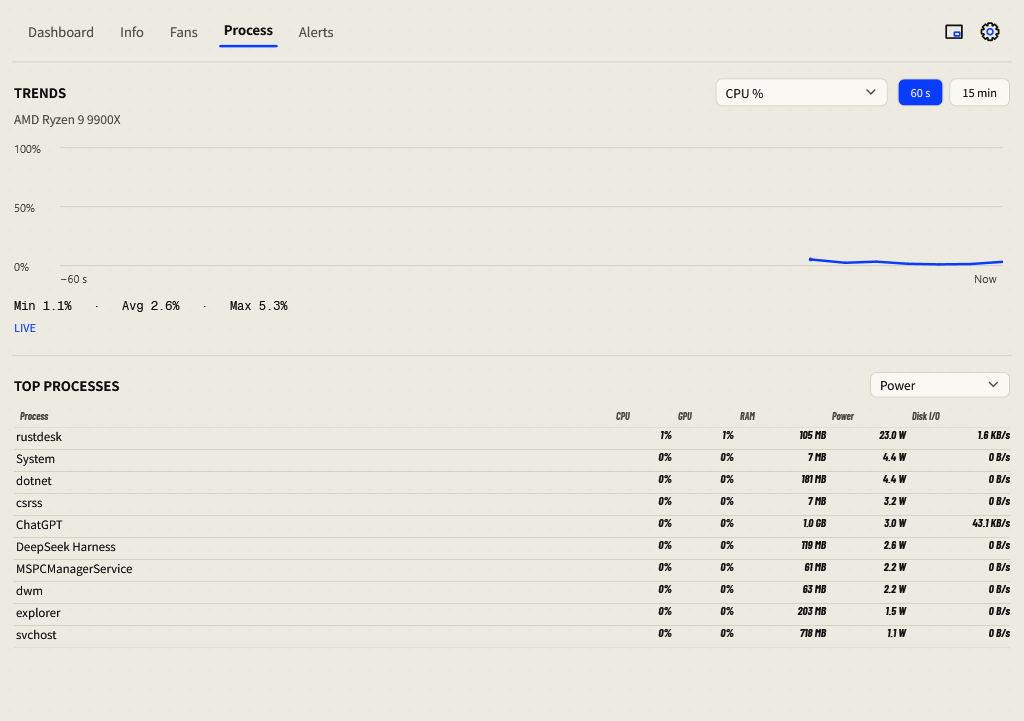
Read a trend
- Open Process from the top navigation, or select CPU, GPU, RAM or DISK on the Dashboard.
- Choose the metric: CPU/GPU load, RAM, GPU memory, available temperature or power.
- Choose 60 s for recent changes or 15 min for a longer view.
- Move the pointer over the chart for sample time and value. Read the displayed minimum, average and maximum.
- For GPU metrics, check the selected GPU. Inspecting it leaves the primary-GPU alert preference intact.
Live trend history covers this launch only, up to the last 15 minutes. It is separate from persistent daily energy and alert history. A restart starts a new chart. Missing sensors and interrupted samples leave gaps; they are not zero-valued samples.
Rank processes
Use Rank processes by to compare attributed power, memory or disk activity. RAM inspection selects memory ranking; DISK inspection selects disk activity. The number of displayed processes is controlled by Settings → General → Processes shown.
Per-process power is attributed using CPU/GPU activity, not a physical measurement. A high memory ranking is not automatically a fault; compare it with available RAM and the current workload. Momo’s process view is for inspection; use Windows tools to manage an application you decide to close.
A chart or table looks empty
Wait for the next successful samples. Check the chosen metric, GPU and sensor notice. An unavailable temperature produces no temperature curve. See Missing readings if the metric stays unavailable.